One classic measure for choosing a relocation locale is population density. Areas of high population density, such as major metropolitan areas, have a number of risk factors for long term survival and sustainability:
- High reliance on centralized power, water, sanitation, and communication systems.
- Dependence on long supply lines to keep shelves stocked
- Crowding and traffic (especially in a disaster, as seen in hurricane evacuations of any major city)
- Lack of sufficient natural resources and space for homesteading or self-sufficiency
The simplest metric for assessing this is population density, or the number of residents per square mile. This is lowest in Alaska and the mountain states, which all have large areas, and no major population centers. In contrast, a few states that are almost entirely urban have extremely high densities.
| Rank | State | Population Density (pop/sq mi) |
|---|---|---|
| 1 | Alaska | 1 |
| 2 | Wyoming | 6 |
| 3 | Montana | 7 |
| 4 | North Dakota | 10 |
| 5 | South Dakota | 11 |
| 6 | New Mexico | 17 |
| 7 | Idaho | 20 |
| 8 | Nebraska | 24 |
| 9 | Nevada | 26 |
| 10 | Utah | 36 |
| 11 | Kansas | 36 |
| 12 | Oregon | 41 |
| 13 | Maine | 43 |
| 14 | Colorado | 52 |
| 15 | Iowa | 55 |
| 16 | Arkansas | 57 |
| 17 | Oklahoma | 57 |
| 18 | Arizona | 60 |
| 19 | Mississippi | 63 |
| 20 | Vermont | 67 |
| 21 | Minnesota | 68 |
| 22 | West Virginia | 76 |
| 23 | Missouri | 88 |
| 24 | Alabama | 95 |
| 25 | Texas | 105 |
| 26 | Wisconsin | 106 |
| 27 | Washington | 107 |
| 28 | Louisiana | 108 |
| 29 | Kentucky | 112 |
| 30 | New Hampshire | 148 |
| 31 | Tennessee | 160 |
| 32 | South Carolina | 162 |
| 33 | Michigan | 175 |
| 34 | Georgia | 177 |
| 35 | Indiana | 184 |
| 36 | North Carolina | 206 |
| 37 | Virginia | 212 |
| 38 | Hawaii | 222 |
| 39 | Illinois | 231 |
| 40 | California | 251 |
| 41 | Ohio | 284 |
| 42 | Pennsylvania | 286 |
| 43 | Florida | 378 |
| 44 | New York | 420 |
| 45 | Delaware | 485 |
| 46 | Maryland | 618 |
| 47 | Connecticut | 741 |
| 48 | Massachusetts | 871 |
| 49 | Rhode Island | 1021 |
| 50 | New Jersey | 1218 |
But looking at the state as a whole can obscure the variation within each state. Some states have a few major cities that significantly skew the numbers. To get a better picture of the variation, we’ve looked at only the least densely populated county for each state:
| Rank | State | Least densely populated county | Population density | Rank difference (vs state overall) |
|---|---|---|---|---|
| 1 | Alaska | Yukon-Koyukuk Census Area | 0.03 | 0 |
| 2 | Texas | Loving County | 0.12 | +23 |
| 3 | Nevada | Esmeralda County | 0.21 | +6 |
| 4 | Montana | Garfield County | 0.25 | -1 |
| 5 | New Mexico | Harding County | 0.32 | +1 |
| 6 | South Dakota | Harding County | 0.47 | -1 |
| 7 | Idaho | Clark County | 0.55 | 0 |
| 8 | Nebraska | McPherson County | 0.63 | 0 |
| 9 | North Dakota | Billings County | 0.68 | -5 |
| 10 | Oregon | Harney County | 0.73 | +2 |
| 11 | Colorado | Hinsdale County | 0.75 | +3 |
| 12 | Wyoming | Niobrara County | 0.94 | -10 |
| 13 | Utah | Garfield County | 0.99 | -3 |
| 14 | Oklahoma | Cimarron County | 1.34 | +3 |
| 15 | California | Alpine County | 1.59 | +25 |
| 16 | Kansas | Greeley County | 1.6 | -5 |
| 17 | New York | Hamilton County | 2.81 | +27 |
| 18 | Minnesota | Lake of the Woods County | 3.11 | +3 |
| 19 | Washington | Garfield County | 3.18 | +8 |
| 20 | Mississippi | Issaquena County | 3.4 | -1 |
| 21 | Michigan | Keweenaw County | 3.99 | +12 |
| 22 | Maine | Piscataquis County | 4.42 | -9 |
| 23 | Arizona | La Paz County | 4.55 | -5 |
| 24 | Louisiana | Cameron Parish | 5.32 | +4 |
| 25 | Virginia | Highland County | 5.59 | +12 |
| 26 | Hawaii | Kalawao County | 7.5 | +12 |
| 27 | Wisconsin | Iron County | 7.8 | -1 |
| 28 | Missouri | Worth County | 8.14 | -5 |
| 29 | Georgia | Clinch County | 8.49 | +5 |
| 30 | Arkansas | Calhoun County | 8.53 | -14 |
| 31 | West Virginia | Pocahontas County | 9.27 | -9 |
| 32 | North Carolina | Hyde County | 9.48 | +4 |
| 33 | Vermont | Essex County | 9.5 | -13 |
| 34 | Iowa | Adams County | 9.51 | -19 |
| 35 | Florida | Liberty County | 10.01 | +8 |
| 36 | Illinois | Pope County | 12.12 | +3 |
| 37 | Pennsylvania | Cameron County | 12.83 | +5 |
| 38 | Alabama | Wilcox County | 13.13 | -14 |
| 39 | New Hampshire | Coos County | 18.41 | -9 |
| 40 | Tennessee | Perry County | 19.08 | -9 |
| 41 | Kentucky | Hickman County | 20.23 | -12 |
| 42 | Indiana | Benton County | 21.78 | -7 |
| 43 | South Carolina | Allendale County | 25.53 | -11 |
| 44 | Ohio | Monroe County | 32.12 | -3 |
| 45 | Maryland | Garrett County | 46.51 | +1 |
| 46 | Massachusetts | Franklin County | 102.05 | +2 |
| 47 | New Jersey | Salem County | 199.1 | +3 |
| 48 | Connecticut | Litchfield County | 206.31 | -1 |
| 49 | Delaware | Sussex County | 210.6 | -4 |
| 50 | Rhode Island | Washington County | 385.67 | -1 |
Note that many states in the South and Appalachia rank much lower here, because they are fairly evenly settled, even though the population density is low. They simply are not frontier states anymore, and there are few “unpeopled” areas left. The mountain states still rank highly, as they have large areas that have never been extensively developed.
Of particular note, seven states rank 12 or more places higher on the second list. These states are all heavily populated overall, but have at least some areas of fairly light population. Any location in these states will still be affected by the massive population centers nearby, but it’s still possible to find lightly populated areas.
| State | Least densely populated county | Population density |
|---|---|---|
| New York | Hamilton County | 2.81 |
| California | Alpine County | 1.59 |
| Texas | Loving County | 0.12 |
| Michigan | Keweenaw County | 3.99 |
| Virginia | Highland County | 5.59 |
| Hawaii | Kalawao County | 7.5 |
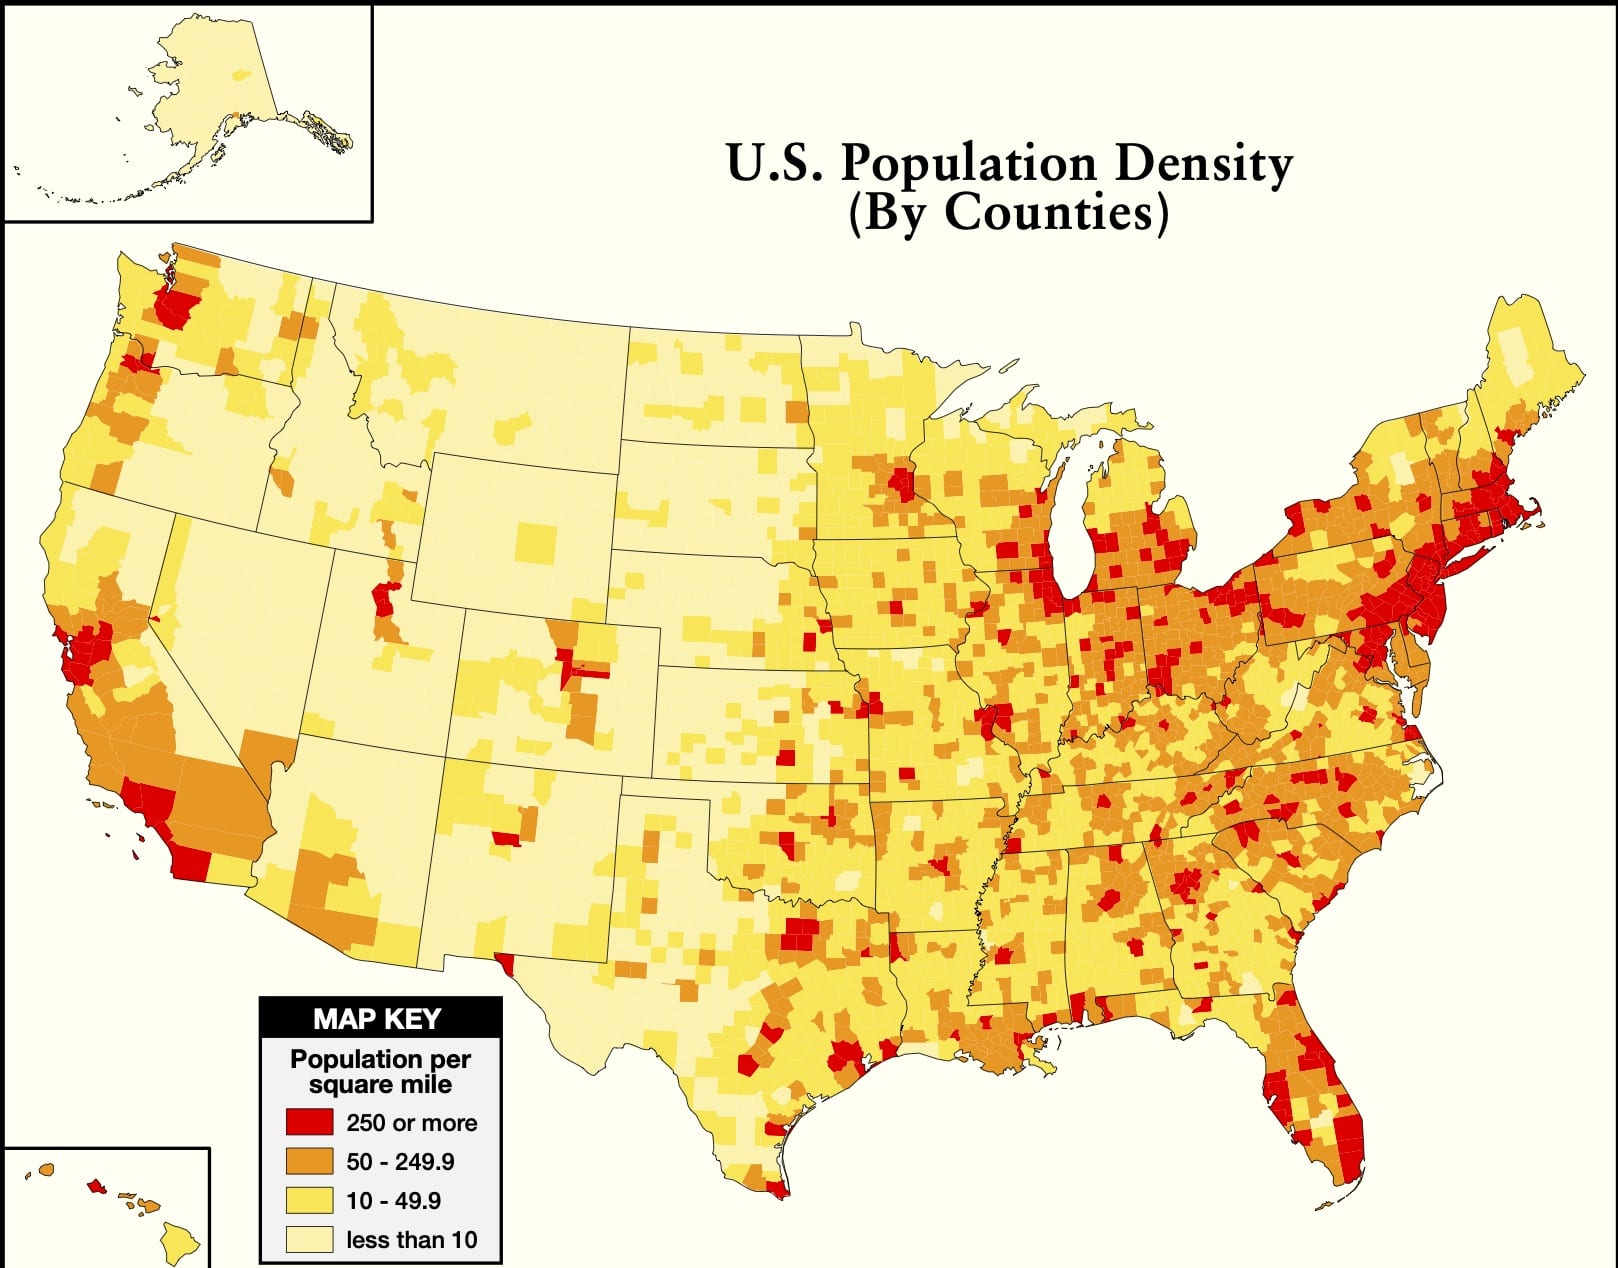
This demonstrates the importance of choosing a location for relocation at the county level. The US Census produces a useful map showing population density for every county in the US:
On the upside, it’s still possible to find rural areas almost anywhere in the US. In these areas you may be able to experience the same rural lifestyle you would in any other region. The residents of these areas may maintain a fairly self-sufficient lifestyle even in an urbanized state.
On the other hand, their proximity to major cities may mean increased tourist traffic, higher home prices, and potential for greater numbers of refugees in the case of major disaster affecting a metro area. Additionally, these regions are likely to have little voice in state and federal government. The long term prospect is either of increasing growth, as property becomes more scarce, or a decline if the region is passed over for development.